Electrical Properties
Finally the electrical properties are computed using
elec_propt = TE.electrical_properties(E = engr, DoS = e_density, vg = grp_velocity, Ef = fermi[1][np.newaxis, :],
                                      dfdE = fermi_dist[1], temp = tmpr, tau = tau)
Electrical properties of Si/ SiC nano-composite.
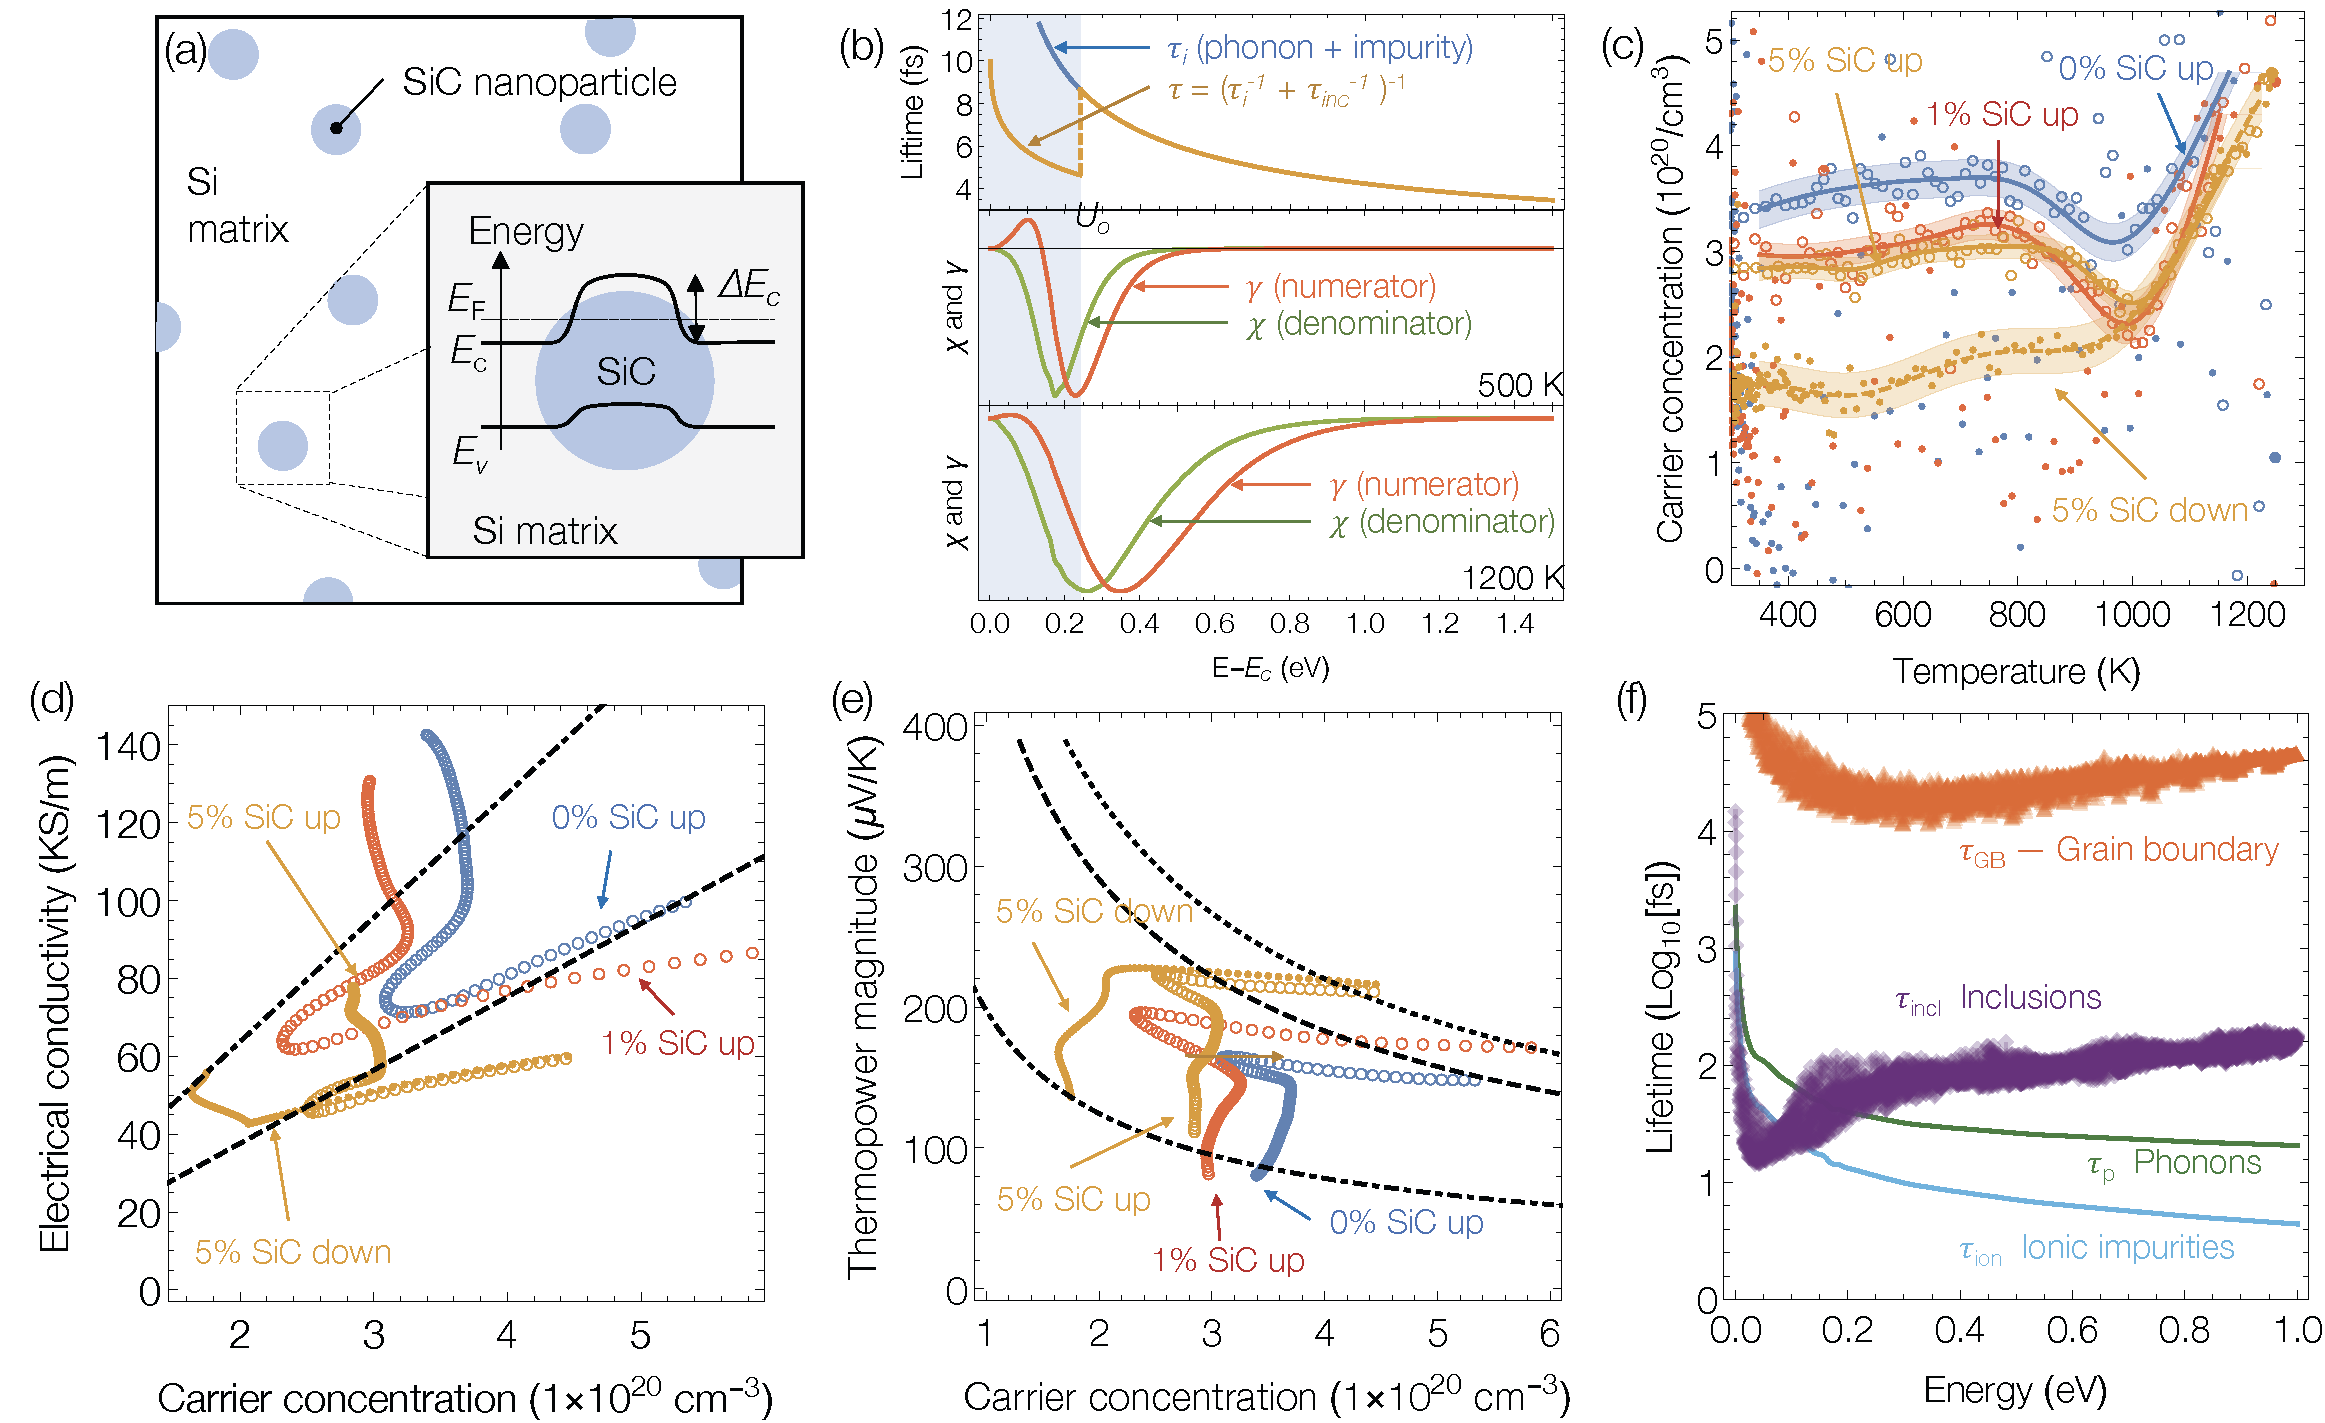
Panel(a) Schematic picture of the energy barrier \(\Delta E_c\) for filtering conduction band electrons in Si due to the conduction band offset of embedded SiC nanoparticles. Panel (b) illustrates the electron energy filtering concept. The upper plot shows the energy dependence of the electron scattering time, including an additional filtering scattering process that is felt by all electrons with energy less than \(U_o\). The lower plots show the kernels \(\chi\) and \(\gamma\), normalized, and plotted at 500 K (middle) and 1200 K (bottom). The additional electron filtering scattering in the shaded region causes a larger reduction of the \(\tau\) weighted integral of \(\chi\) than \(\gamma\). Panel (c) shows the temperature dependence of the experimentally measured carrier concentration, \(N_i\), for P-doped silicon with 0% (blue), 1% (red) and 5% (gold) volume fraction of SiC. You open circles and dots show the measurements made during heating and cooling respectively. The solid and dashed lines show Gaussian process regression fit (and corresponding uncertainty) to the four least noisy data sets. Plots (d&e) show the variation in electrical conductivity and thermopower with carrier concentration using the same color coding and symbols as in (c). In (d) the black lines provide a guide to the eye to illustrate the isothermal change in conductivity due to differences in carrier concentration. The dashed line compares how the 0% SiC conductivity at 1285 K would change with \(N_i\) and it can be seen that the materials with SiC inclusions are more restive than a material with the same \(N_i\) but without inclusions. The dot-dashed line shows a similar guide fit to the 300 K conductivity of the material with 5% SiC after heating and cooling. In plot (e) the black lines show isothermal \(N_i^{-2/3}\) dependence expected of parabolic band material. As in (d), the dashed and dot-dashed lines are fit to the high-temperature measurement of the material with 0% SiC, and the low-temperature measurement in the cooled material with 5% SiC. The dotted line is fit to the high-temperature measurement of the material with 1% SiC. At both high and low temperatures the materials with a higher fraction of inclusions have thermopower larger than that predicted by the variation in \(N_i\). Panel (f) plots the electron lifetime for the different scattering mechanisms described in the text for Si at 500 K with a carrier population of \(\mathrm{2.8 \times 10^{20}\ 1/cm^3}\). It can be seen that the electron-inclusion scattering (purple) is dominant for electrons with energies less than ~0.12 eV. The scattering of electrons with higher energies is dominated by electron-impurity scattering (blue). The electron-grain boundary (\(l_g= 50\ nm\)) and electron-inclusion (inclusion radius of \(\mathrm{4\ nm}\)) for 5% SiC inclusion are two additional scattering terms Si nanocomposite and are shown in orange and green, respectively.